


このアプリのYoutube動画がある場合はURLを送信してください。詳細 »
APPLICATION INFO - iPhoneアプリの詳細情報
TOP > エンターテインメント > Hedonometer
Hedonometer is a new app that displays Hedonometer.org's social media-based sentiment analysis - an innovative measure of social happiness.
The graph displays up to three years of data. Previous years are overlayed year-to-date so you can compare a given data or date ranges to previous years.
The language used for the sentiment analysis can be set with the language setting. You can also select various graph styles to help see the data that suites your preference. And you can toggle seeing the previous year or the year before that to be able to compare historical timelines, or just focus in this year’s data.
You can explore data by tapping on the graph to display a cursor that you can move around by holding your finger down and sliding the cursor left or right. The app will show you the data at the cursor position.
You can zoom the graph with the graph scale slider control. The scale ranges from 6 weeks to a full year. When you are zoomed in, you can swipe left or right on the graph to scroll to other areas of the graph.
The Watch app displays the same interactive graph with similar controls. The Watch uses the crown wheel to zoom in and out of the graph when the cursor is not active, and moves the cursor when the cursor is enabled.
The dark green area under the graph in the iPhone will show annotations for important events when you are exploring the happiness timeline data.
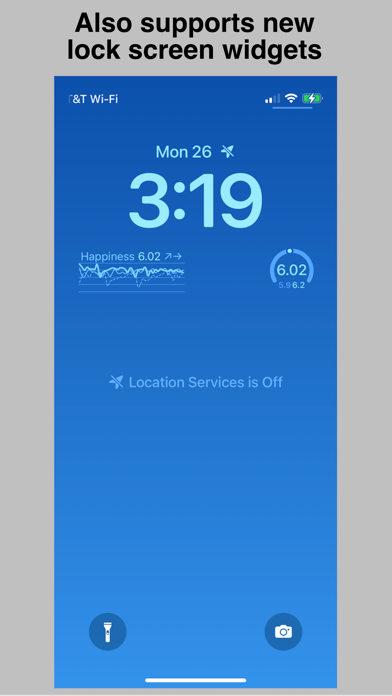
The app supports Watch complications and iPhone widgets including the new iOS 16 Lock Screen widgets. Data for complications and widgets is automatically updated in the background, so there is no need to open or manually refresh the app to see the latest data. Hedonometer.org's data is updated once a day. The complications and widgets always show the most recent data using whatever time range scale you’ve set. The information displayed will be the most recent happiness index, plus the trends over the most recent two days…sort of like a social happiness barometer. Because Watch complications and Lock Screen widgets may be monochrome only, the app uses line weights and styling for displaying each of the three years - a thick line for most recent, a thin solid line for a year ago, and a dashed line for two years ago.
The “More information” page provides information about the University of Vermont’s Hedonometer project and a bit more information about the app itself.
We hope you enjoy!
The graph displays up to three years of data. Previous years are overlayed year-to-date so you can compare a given data or date ranges to previous years.
The language used for the sentiment analysis can be set with the language setting. You can also select various graph styles to help see the data that suites your preference. And you can toggle seeing the previous year or the year before that to be able to compare historical timelines, or just focus in this year’s data.
You can explore data by tapping on the graph to display a cursor that you can move around by holding your finger down and sliding the cursor left or right. The app will show you the data at the cursor position.
You can zoom the graph with the graph scale slider control. The scale ranges from 6 weeks to a full year. When you are zoomed in, you can swipe left or right on the graph to scroll to other areas of the graph.
The Watch app displays the same interactive graph with similar controls. The Watch uses the crown wheel to zoom in and out of the graph when the cursor is not active, and moves the cursor when the cursor is enabled.
The dark green area under the graph in the iPhone will show annotations for important events when you are exploring the happiness timeline data.
The app supports Watch complications and iPhone widgets including the new iOS 16 Lock Screen widgets. Data for complications and widgets is automatically updated in the background, so there is no need to open or manually refresh the app to see the latest data. Hedonometer.org's data is updated once a day. The complications and widgets always show the most recent data using whatever time range scale you’ve set. The information displayed will be the most recent happiness index, plus the trends over the most recent two days…sort of like a social happiness barometer. Because Watch complications and Lock Screen widgets may be monochrome only, the app uses line weights and styling for displaying each of the three years - a thick line for most recent, a thin solid line for a year ago, and a dashed line for two years ago.
The “More information” page provides information about the University of Vermont’s Hedonometer project and a bit more information about the app itself.
We hope you enjoy!
カテゴリー
エンターテインメント
エンターテインメント
リリース
2022/9/26
2022/9/26
バージョン
1.5
1.5
言語
サイズ
5.7 MB
5.7 MB
条件
スクリーンショット
Bog Bridges LLC の他のアプリ » もっと見る
» 目的別iPhoneアプリ検索
- 辞書 » 日本語対応の辞書 » 英和辞典
- 学習 » 英単語 » 英会話 » クイズで楽しく
- スケジュール » 管理 » Googleカレンダー


おもしろウォッチ - 無料でおもしろいニュースが読み放題 -
Takuya Tanaka無料
GYAO! 映画もアニメも音楽も。プレミアム動画を楽しむなら..
Yahoo Japan Corp.無料
STOP通信制限!通信量チェッカーで通信料節約! for w..
App Land, Inc.無料
【これマジ!?】ホンマでっか ~アッと驚く都市伝説~
Motoyama Tomoki無料
進撃のカマ戦争ビギンズ-新感覚オカマ育成ゲーム!無料の放置ゲ..
nana ito無料
サクサクMusicBox アーティスト丸ごと聴き放題!音楽聴..
AppAge Limited無料
モンスト全国マルチ掲示板アプリ for モンスターストライク
SVC inc無料
モンスト攻略
AppBank Inc.無料
niconico
DWANGO Co., Ltd.無料
ポイントで有料スタンプ取り放題 ~ゆるカワ系スタンプ版~ f..
Assist,Inc無料


CatchApp新着アプリレビュー
 日本縦断てつどうの旅」")
様々な楽しみ方で運転士として成長していく鉄道運転士育成RPG「プラチナ・トレイン(プラトレ) 日本縦断てつどうの旅」
2016-05-17 00:00

日本語にはない英語発音のリスニングを楽しく学べる「発音どっち?英語リスニング 」
2014-12-20 12:00

指先の瞬発力が試されるカジュアルゲーム「早撃ちパニック」をリリース!
2014-12-08 15:21
新着アプリ動画
-
 ¥1500
¥1500
-
 ¥600
¥600
-
 ¥3000
¥3000