


このアプリのYoutube動画がある場合はURLを送信してください。詳細 »
APPLICATION INFO - iPhoneアプリの詳細情報
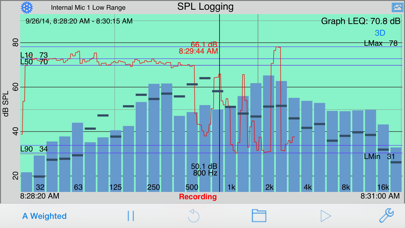
SPL Graph is an audio Sound Pressure Level (SPL) environmental noise analyzer, real-time frequency analyzer, chart recorder and data logger. It includes:
* Plot sound level over time
* Record audio while plot is running
* Capture video of events (optional in-app purchase)
* Do octave and 1/3 octave band analysis (optional in-app purchase)
* Show a 3D Plot of octave or 1/3 octave results
* Calculate Ln SPL values, L01, L10, L50, L90, L95, LMax and LMin
* Email notifications when sound exceeds pre-set limits
* Auto-save results after set intervals, and email the results to you
* Start another plot after auto-saving for continuous operation
SPL Graph works by averaging the SPL for a period of time that can vary from 0.1 second to 60 minutes, applying an optional weighting filter, and plotting the sound level, recording the raw audio signal, if recording is turned on.
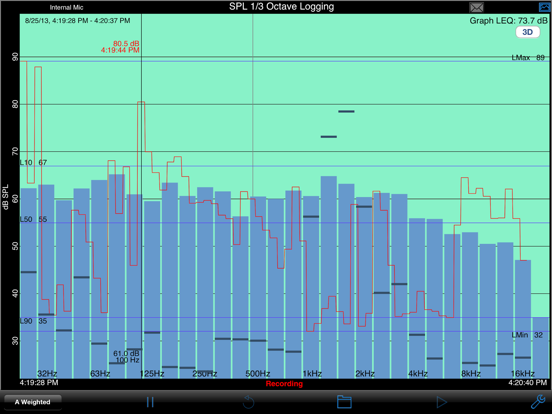
For sound intervals of 1.0 second to 60 minutes, the optional octave and 1/3 octave logging modules allows storing the spectrum of the sound, for each interval.
The app works very well with the built-in iOS device microphone. To upgrade the app to true professional standards, add our iTestMic, iPrecisionMic, or iAudioInterface2 with an appropriate microphone, and get ANSI or ISO Type 1 or 2 results. With iPrecisionMic, you can actually send the system in to our calibration lab and get a calibration certificate for ISO 61672 and ANSI S1.4.
SPL Graph can record up to 24 hours of sound level data, with single second resolution. The graph starts with a one-minute plot window, and as a minute is recorded, the graph re-scales automatically and adds another minute to show the data collected so far. The overall SPL level, or LEQ, is displayed for whatever portion of the test is showing on the graph.
Tap the play button to play back the recorded audio, and you can use the cursor to scrub the audio location on the graph. Use this feature to listen to events that you can see on the graph.
With the optional octave logging module, you can also record the octave or 1/3 octave band levels. And, you can view the data on the 3D plot for a graphical view of frequency over time.
You can scroll and scale the graph vertically, in dB, by using standard swipe and pinch gestures. You can also scroll and expand and contract the time axis using gestures. Zoom out to a full 24 hours, or zoom in to a single minute, showing second resolution. Double-tap the screen to zoom out to show the entire graph on the screen.
The time scale grid changes dynamically, highlighting minutes, ten-minute, and hour lines as as it runs.
As the graph runs, the overall LEQ (average SPL) for the entire time period is computed and displayed on the screen. Swiping across the graph brings up a cursor that displays the exact dB level and time for any point on the graph.
You can turn on audio recording, so that you have a record of the sounds that were happening while the graph was being stored. You can use this to figure out exactly what the sound was that caused a peak on the graph, for example. Recordings can be compressed or uncompressed.
If you exit the app, or are interrupted with a phone call, the graph data will not be lost. SPL Graph will automatically save the graph, and reload it when you next open the program. You can also save a graph in one of ten files on the iPhone, so that you can recall the graph later.
SPL Graph supports saving graphs directly on your iOS device. You can recall these graphs and bring them up on the screen, and listen to the sounds that were made while the graph was recorded. You can also store an image of the screen to your photo roll. Use Dropbox or iTunes Files Sharing to export the results to your computer.
You can also export data in tab-delimited files for XLS import. Dropbox is supported for automatic file transfer.
The filters are all ANSI type 1 or better, and include A-weighting, C-weighting, and all octaves band filters from 32 to 16kHz.
* Plot sound level over time
* Record audio while plot is running
* Capture video of events (optional in-app purchase)
* Do octave and 1/3 octave band analysis (optional in-app purchase)
* Show a 3D Plot of octave or 1/3 octave results
* Calculate Ln SPL values, L01, L10, L50, L90, L95, LMax and LMin
* Email notifications when sound exceeds pre-set limits
* Auto-save results after set intervals, and email the results to you
* Start another plot after auto-saving for continuous operation
SPL Graph works by averaging the SPL for a period of time that can vary from 0.1 second to 60 minutes, applying an optional weighting filter, and plotting the sound level, recording the raw audio signal, if recording is turned on.
For sound intervals of 1.0 second to 60 minutes, the optional octave and 1/3 octave logging modules allows storing the spectrum of the sound, for each interval.
The app works very well with the built-in iOS device microphone. To upgrade the app to true professional standards, add our iTestMic, iPrecisionMic, or iAudioInterface2 with an appropriate microphone, and get ANSI or ISO Type 1 or 2 results. With iPrecisionMic, you can actually send the system in to our calibration lab and get a calibration certificate for ISO 61672 and ANSI S1.4.
SPL Graph can record up to 24 hours of sound level data, with single second resolution. The graph starts with a one-minute plot window, and as a minute is recorded, the graph re-scales automatically and adds another minute to show the data collected so far. The overall SPL level, or LEQ, is displayed for whatever portion of the test is showing on the graph.
Tap the play button to play back the recorded audio, and you can use the cursor to scrub the audio location on the graph. Use this feature to listen to events that you can see on the graph.
With the optional octave logging module, you can also record the octave or 1/3 octave band levels. And, you can view the data on the 3D plot for a graphical view of frequency over time.
You can scroll and scale the graph vertically, in dB, by using standard swipe and pinch gestures. You can also scroll and expand and contract the time axis using gestures. Zoom out to a full 24 hours, or zoom in to a single minute, showing second resolution. Double-tap the screen to zoom out to show the entire graph on the screen.
The time scale grid changes dynamically, highlighting minutes, ten-minute, and hour lines as as it runs.
As the graph runs, the overall LEQ (average SPL) for the entire time period is computed and displayed on the screen. Swiping across the graph brings up a cursor that displays the exact dB level and time for any point on the graph.
You can turn on audio recording, so that you have a record of the sounds that were happening while the graph was being stored. You can use this to figure out exactly what the sound was that caused a peak on the graph, for example. Recordings can be compressed or uncompressed.
If you exit the app, or are interrupted with a phone call, the graph data will not be lost. SPL Graph will automatically save the graph, and reload it when you next open the program. You can also save a graph in one of ten files on the iPhone, so that you can recall the graph later.
SPL Graph supports saving graphs directly on your iOS device. You can recall these graphs and bring them up on the screen, and listen to the sounds that were made while the graph was recorded. You can also store an image of the screen to your photo roll. Use Dropbox or iTunes Files Sharing to export the results to your computer.
You can also export data in tab-delimited files for XLS import. Dropbox is supported for automatic file transfer.
The filters are all ANSI type 1 or better, and include A-weighting, C-weighting, and all octaves band filters from 32 to 16kHz.
 このアプリはiPhone、iPadの両方に対応しています。
カテゴリー
ミュージック
ミュージック
リリース
2009/3/27
2009/3/27
更新
2016/8/11
2016/8/11
バージョン
6.0
6.0
言語
英語
英語
サイズ
21.6 MB
21.6 MB
条件
iPhone、iPod touch および iPad 互換 iOS 4.3 以降が必要 iPhone 5 用に最適化済み
iPhone、iPod touch および iPad 互換 iOS 4.3 以降が必要 iPhone 5 用に最適化済み
このバージョンの新機能
SPL Graph, best noise monitoring and audio sound level logging app
-- Fixed issues with Running Leq mode on the minimal display
-- If auto-save is turned on, when a test is stopped it will also be automatically auto-saved.
SPL Graph, best noise monitoring and audio sound level logging app
-- Fixed issues with Running Leq mode on the minimal display
-- If auto-save is turned on, when a test is stopped it will also be automatically auto-saved.
スクリーンショット - iPhone | iPad
スクリーンショット - iPhone | iPad
Andrew Smith の他のアプリ » もっと見る
» 目的別iPhoneアプリ検索
- 辞書 » 日本語対応の辞書 » 英和辞典
- 学習 » 英単語 » 英会話 » クイズで楽しく
- スケジュール » 管理 » Googleカレンダー


音楽 無料で聴き放題!! Music Tubee for Y..
MobiRocket, Inc.無料
無料で全ての音楽/ラジオ聴き放題!- Smart Music..
ITI Inc.無料
YouTube動画アプリ Tubee for YouTube..
MobiRocket, Inc.無料
MB2: YouTube音楽連続再生ビデオ プレイヤー (ア..
MixerBox Inc.無料
無料で音楽ダウンロード - SCから無料な音楽
SUN HAI YAN無料
Musify - 無料ミュージックをダウンロード - MP3..
Alfadevs無料
Calculator Box - Private Video..
XU YI PING無料
Magic Piano by Smule
Smule無料
Shazam - 音楽認識
Apple無料
Sing! カラオケ
Smule無料


CatchApp新着アプリレビュー
 日本縦断てつどうの旅」")
様々な楽しみ方で運転士として成長していく鉄道運転士育成RPG「プラチナ・トレイン(プラトレ) 日本縦断てつどうの旅」
2016-05-17 00:00

日本語にはない英語発音のリスニングを楽しく学べる「発音どっち?英語リスニング 」
2014-12-20 12:00

指先の瞬発力が試されるカジュアルゲーム「早撃ちパニック」をリリース!
2014-12-08 15:21
新着アプリ動画
-
 ¥1500
¥1500
-
 ¥600
¥600
-
 ¥3000
¥3000