


このアプリのYoutube動画がある場合はURLを送信してください。詳細 »
APPLICATION INFO - iPhoneアプリの詳細情報
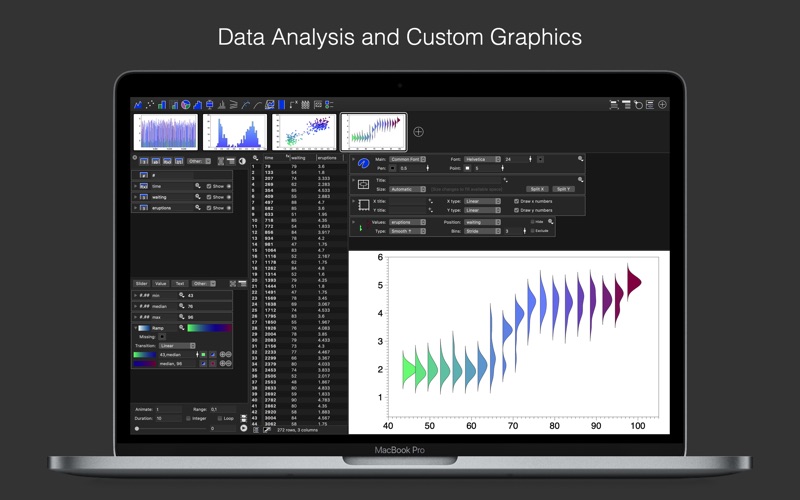
DataGraph is a tool for data analysis and graphing.
DataGraph is a tool for creating beautiful custom-graphics and publication quality figures and animations. DataGraph allows you to control every aspect of a graph. Save time by seeing changes in real-time. You can easily add labels and annotations. You will no longer need to create a graph in one program and annotate or refine it in another, like Illustrator. Do it all in DataGraph. Export graphs as bitmaps or pdf/eps/svg vector graphics. Export movies as mp4 files.
DataGraph is a tool for data analysis, with a unique visual display. Every column of data and every command is a visual object that can be dragged around, hidden from view, or copy and pasted to other graphs or files. The commands in the program are like drawing primitives that have basic options by default but can be made increasingly complex. By combining commands, you can create amazing graphics and animations.
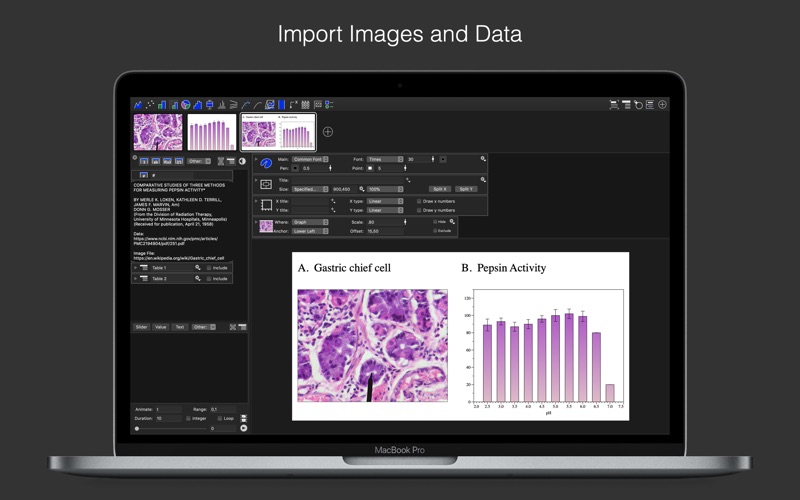
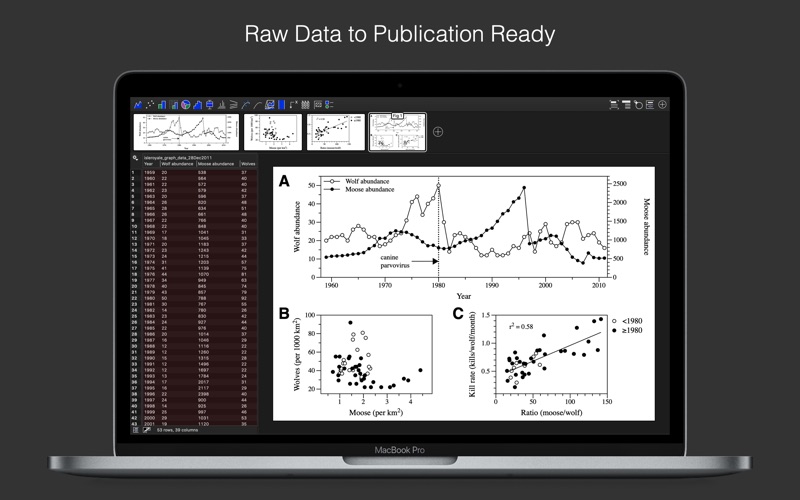
Our company recognizes the importance of reproducibility and transparency. Every option and action taken on a graph or data set is documented. The program has a data-flow approach, which allows you to go from raw datasets to final publication-quality graphs in one file. Since the data and graphics are all together, DataGraph solves the problem of having processed data or graphics, where the original dataset is in question.
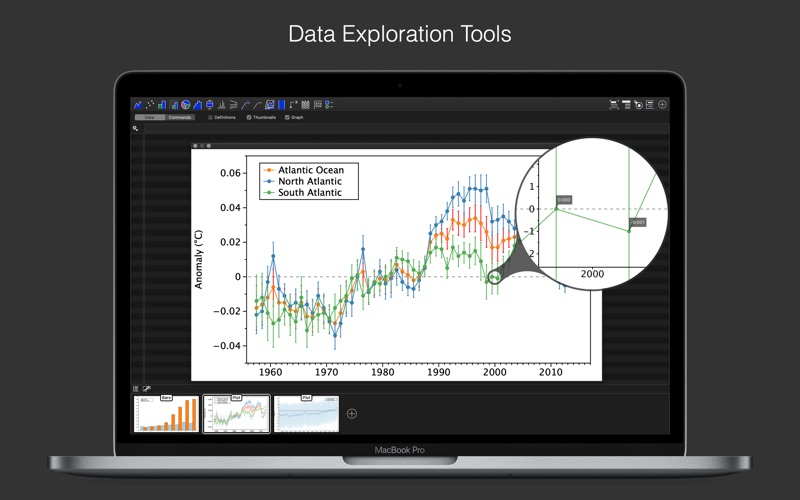
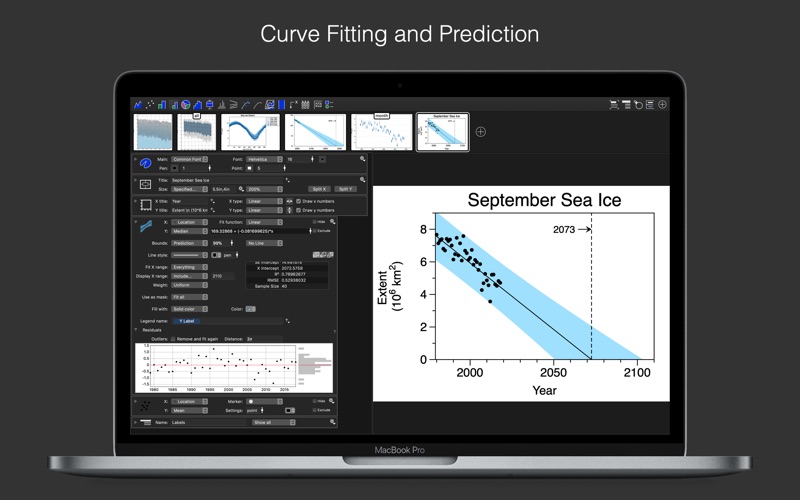
Our goal is to make it easy and fast to accomplish common data analysis tasks that researchers rely on (e.g., linear regression, non-linear curve fitting, t-tests, etc.). Our can not only replace spreadsheets, but also fills the niche between spreadsheets and text-based coding languages. Spreadsheets may be quick and easy to start with, but lack the robustness and reproducibility that scientists and engineers require. Text-based coding languages have the benefit of being robust and flexible, but can be tedious and time consuming to code and are simply not appealing to many students and researchers.
Our approach from day one with DataGraph has been to rely on community-driven development, where feedback from users has shaped the evolution of the program for over 10 years. DataGraph is a mature data analysis and visualization tool, but we continue to welcome suggestions and feedback from our community, and the program continues to evolve with the needs of our users.
A free trial is available from the DataGraph web site, so it is easy to see it for yourself before you purchase. Be sure to visit our community web-site for a discussion forum, on-line help, and tutorials. Check out our YouTube channel. Provide feedback or ask questions on the discussion forum or by email.
DataGraph is created by the same company that made DataTank, a high end scientific application, which won the Apple Design Award in 2005 as the best Mac OS X Scientific Computing Solution.
DataGraph is a tool for creating beautiful custom-graphics and publication quality figures and animations. DataGraph allows you to control every aspect of a graph. Save time by seeing changes in real-time. You can easily add labels and annotations. You will no longer need to create a graph in one program and annotate or refine it in another, like Illustrator. Do it all in DataGraph. Export graphs as bitmaps or pdf/eps/svg vector graphics. Export movies as mp4 files.
DataGraph is a tool for data analysis, with a unique visual display. Every column of data and every command is a visual object that can be dragged around, hidden from view, or copy and pasted to other graphs or files. The commands in the program are like drawing primitives that have basic options by default but can be made increasingly complex. By combining commands, you can create amazing graphics and animations.
Our company recognizes the importance of reproducibility and transparency. Every option and action taken on a graph or data set is documented. The program has a data-flow approach, which allows you to go from raw datasets to final publication-quality graphs in one file. Since the data and graphics are all together, DataGraph solves the problem of having processed data or graphics, where the original dataset is in question.
Our goal is to make it easy and fast to accomplish common data analysis tasks that researchers rely on (e.g., linear regression, non-linear curve fitting, t-tests, etc.). Our can not only replace spreadsheets, but also fills the niche between spreadsheets and text-based coding languages. Spreadsheets may be quick and easy to start with, but lack the robustness and reproducibility that scientists and engineers require. Text-based coding languages have the benefit of being robust and flexible, but can be tedious and time consuming to code and are simply not appealing to many students and researchers.
Our approach from day one with DataGraph has been to rely on community-driven development, where feedback from users has shaped the evolution of the program for over 10 years. DataGraph is a mature data analysis and visualization tool, but we continue to welcome suggestions and feedback from our community, and the program continues to evolve with the needs of our users.
A free trial is available from the DataGraph web site, so it is easy to see it for yourself before you purchase. Be sure to visit our community web-site for a discussion forum, on-line help, and tutorials. Check out our YouTube channel. Provide feedback or ask questions on the discussion forum or by email.
DataGraph is created by the same company that made DataTank, a high end scientific application, which won the Apple Design Award in 2005 as the best Mac OS X Scientific Computing Solution.
カテゴリー
仕事効率化
仕事効率化
リリース
2010/12/22
2010/12/22
バージョン
4.5.1
4.5.1
言語
サイズ
42.8 MB
42.8 MB
条件
このバージョンの新機能
New!
* Added a menu entry to hide the toolbar, under the View menu.
* Added a method for the group, to append subgroups.
* Added a 'Line Join' option for the Plot command.
Improved!
* Works even better with Catalina and dark mode!
Fixed!
* Paste Speci
New!
* Added a menu entry to hide the toolbar, under the View menu.
* Added a method for the group, to append subgroups.
* Added a 'Line Join' option for the Plot command.
Improved!
* Works even better with Catalina and dark mode!
Fixed!
* Paste Speci
スクリーンショット
» 目的別iPhoneアプリ検索
- 辞書 » 日本語対応の辞書 » 英和辞典
- 学習 » 英単語 » 英会話 » クイズで楽しく
- スケジュール » 管理 » Googleカレンダー


Microsoft Excel
Microsoft Corporation無料
Microsoft Word
Microsoft Corporation無料
Microsoft PowerPoint
Microsoft Corporation無料
QRコードリーダー for iPhone
Takashi Wada無料
QRコードリーダー for iPhone - 無料で使えるQ..
無料
Gmail - Googleのメール
Google LLC無料
Lifebear カレンダーと日記とToDoを無料でスケジュ..
Lifebear inc.無料
Dropbox
Dropbox, Inc.無料
無料QRコードリーダー・バーコードリーダー-アイコニット
MEDIASEEK Inc.無料
Google ドライブ - 安全なオンライン ストレージ
Google LLC無料


CatchApp新着アプリレビュー
 日本縦断てつどうの旅」")
様々な楽しみ方で運転士として成長していく鉄道運転士育成RPG「プラチナ・トレイン(プラトレ) 日本縦断てつどうの旅」
2016-05-17 00:00

日本語にはない英語発音のリスニングを楽しく学べる「発音どっち?英語リスニング 」
2014-12-20 12:00

指先の瞬発力が試されるカジュアルゲーム「早撃ちパニック」をリリース!
2014-12-08 15:21
新着アプリ動画
-
 ¥1500
¥1500
-
 ¥600
¥600
-
 ¥3000
¥3000