


このアプリのYoutube動画がある場合はURLを送信してください。詳細 »
APPLICATION INFO - iPhoneアプリの詳細情報
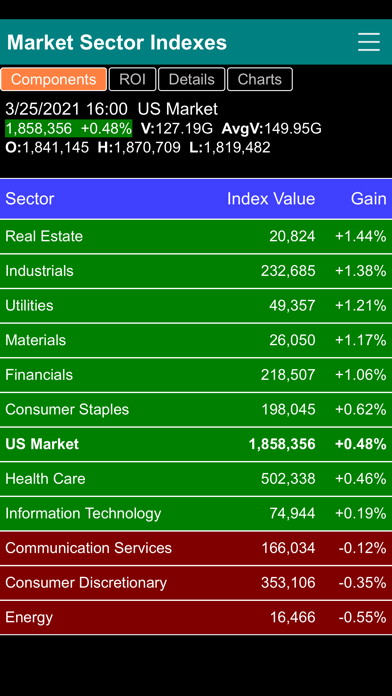
The US Market Indexes publication from Bull Laboratories (BullLabs.com) is a collection of stock market composite indexes that includes more than six hundreds public trading companies and ADRs with the largest market capitalizations on the NYSE, NASDAQ, AMEX stock exchanges and the OTCBB (Over-The-Counter Bulletin Board). The group of indexes currently contains 634 stocks from 11 sectors categorized into 69 industries, with the composition weight of each component adjusted periodically based on its market capitalization.
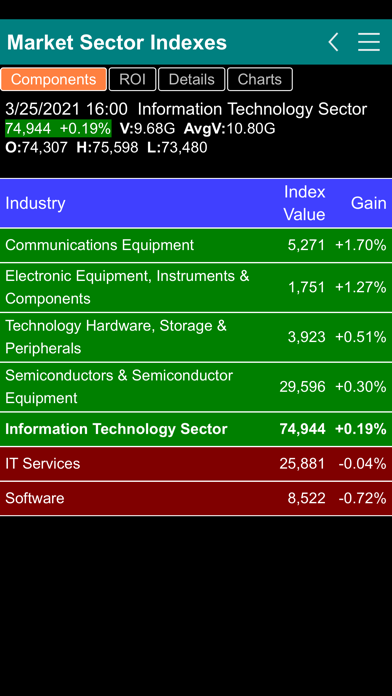
In additional to standard pricing and volume data, other financial data and numbers for each sector and industry are also derived and calculated based on the numbers and allocations of its underlying components. For example, the EPS (earning per share) an industry is obtained by summing up the EPS numbers of each component multiplied by number of shares in the holding. This allows investors to benchmark the performance of investment based on specific stock market sectors or industries.
Intraday index pricing and volume data are calculated based on real time market data. Other financial data and characteristics are derived on a daily basis after market close. Subscribed users have access to up-to-date and detailed index data as well as unlimited download of historic numbers and charts.
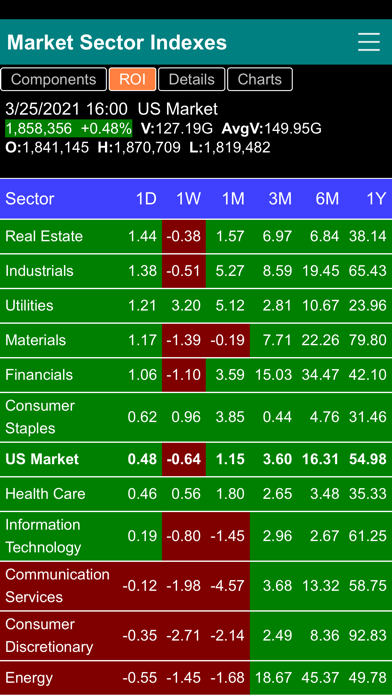
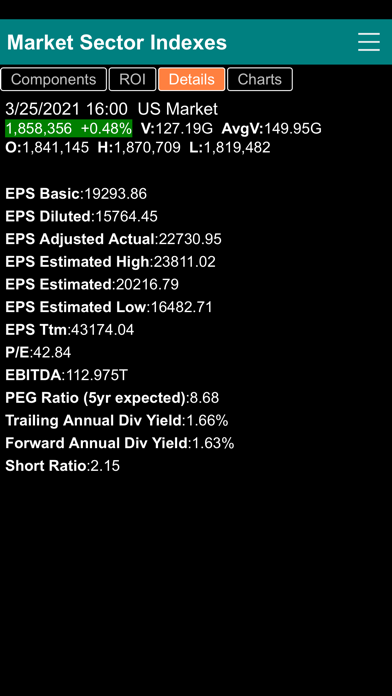
This app includes four types of information for each sector or industry index. The Components screen gives a list of underlying components of the index with prices and gains/losses. The Performance screen shows the list of components of the index with performance data from daily, weekly, monthly, 3-month, 6-month and one year periods. The Details screen gives specific information of each index, including the trading volume, the 52-week average volume, the allocation percentage of the industry within the sector, earning per share (ttm EPS) of the index and the Price to Earning (ttm P/E) of the index. The Graph screen gives the monthly, weekly and daily price chart of the index.
Sector and Industry specific indexes allow investors to benchmark the performance of investment based on specific stock market sectors or industries. Just as all stocks tend to move based on the underlying factors that drive the overall market, stocks in a similar industry tend to move based on underlying factors that affect the industry. One of the most basic methods for understanding the risk of an investment portfolio is to determine its sector breakdown. Is the portfolio spread across different industrial sectors or is it concentrated in just a few? This provides a good indication of how an investment portfolio will respond to macroeconomic factors or industry trends.
Market sector and industry indexes are also essential tools for the Sector Rotation Investment Strategy. A rotation strategy is very similar in approach to tactical asset allocation, but rather than asset classes, the investor will allocate his funds to specific sectors or industries depending on the short-term view. The investor will overweight the sectors or industries that he or she believes will outperform and underweight those expected to underperform.
In additional to standard pricing and volume data, other financial data and numbers for each sector and industry are also derived and calculated based on the numbers and allocations of its underlying components. For example, the EPS (earning per share) an industry is obtained by summing up the EPS numbers of each component multiplied by number of shares in the holding. This allows investors to benchmark the performance of investment based on specific stock market sectors or industries.
Intraday index pricing and volume data are calculated based on real time market data. Other financial data and characteristics are derived on a daily basis after market close. Subscribed users have access to up-to-date and detailed index data as well as unlimited download of historic numbers and charts.
This app includes four types of information for each sector or industry index. The Components screen gives a list of underlying components of the index with prices and gains/losses. The Performance screen shows the list of components of the index with performance data from daily, weekly, monthly, 3-month, 6-month and one year periods. The Details screen gives specific information of each index, including the trading volume, the 52-week average volume, the allocation percentage of the industry within the sector, earning per share (ttm EPS) of the index and the Price to Earning (ttm P/E) of the index. The Graph screen gives the monthly, weekly and daily price chart of the index.
Sector and Industry specific indexes allow investors to benchmark the performance of investment based on specific stock market sectors or industries. Just as all stocks tend to move based on the underlying factors that drive the overall market, stocks in a similar industry tend to move based on underlying factors that affect the industry. One of the most basic methods for understanding the risk of an investment portfolio is to determine its sector breakdown. Is the portfolio spread across different industrial sectors or is it concentrated in just a few? This provides a good indication of how an investment portfolio will respond to macroeconomic factors or industry trends.
Market sector and industry indexes are also essential tools for the Sector Rotation Investment Strategy. A rotation strategy is very similar in approach to tactical asset allocation, but rather than asset classes, the investor will allocate his funds to specific sectors or industries depending on the short-term view. The investor will overweight the sectors or industries that he or she believes will outperform and underweight those expected to underperform.
 このアプリはiPhone、iPadの両方に対応しています。
カテゴリー
ファイナンス
ファイナンス
リリース
2020/12/28
2020/12/28
更新
2021/3/26
2021/3/26
バージョン
2.0
2.0
言語
サイズ
1.3 MB
1.3 MB
条件
このバージョンの新機能
Intraday indexes calculated from real time market data.
New data matrixes for all the indexes including EPS, P/E, short ratio … and much more.
New platform supporting additional matrixes to be added in the future without the need to update the app.
Intraday indexes calculated from real time market data.
New data matrixes for all the indexes including EPS, P/E, short ratio … and much more.
New platform supporting additional matrixes to be added in the future without the need to update the app.
スクリーンショット - iPhone | iPad
スクリーンショット - iPhone | iPad
George Kung の他のアプリ » もっと見る
» 目的別iPhoneアプリ検索
- 辞書 » 日本語対応の辞書 » 英和辞典
- 学習 » 英単語 » 英会話 » クイズで楽しく
- スケジュール » 管理 » Googleカレンダー


au WALLET
KDDI CORPORATION無料
楽天カード
RAKUTEN CARD,INC.無料
セゾンPortal/クレジット管理
Credit Saison Co., Ltd.無料
家計簿おカネレコ - 人気おこづかい帳家計簿(かけいぼ)
Smart Idea inc.無料
家計簿でおこづかいが貯まる!ポイントGET家計簿アプリ!家計..
Aiko Tanaka無料
家計簿Zaimレシート読取・自動連携が無料の人気簡単アプリ
Zaim Inc.無料
かんたん家計簿 ポチレコ(POCHIRECO)
Yahoo Japan Corp.無料
楽天銀行
楽天銀行株式会社無料
Yahoo!ファイナンス - 株価・為替の総合アプリ(無料)
Yahoo Japan Corp.無料
エポスカード公式アプリ
株式会社エポスカード無料


CatchApp新着アプリレビュー
 日本縦断てつどうの旅」")
様々な楽しみ方で運転士として成長していく鉄道運転士育成RPG「プラチナ・トレイン(プラトレ) 日本縦断てつどうの旅」
2016-05-17 00:00

日本語にはない英語発音のリスニングを楽しく学べる「発音どっち?英語リスニング 」
2014-12-20 12:00

指先の瞬発力が試されるカジュアルゲーム「早撃ちパニック」をリリース!
2014-12-08 15:21
新着アプリ動画
-
 ¥1500
¥1500
-
 ¥600
¥600
-
 ¥3000
¥3000