


このアプリのYoutube動画がある場合はURLを送信してください。詳細 »
APPLICATION INFO - iPhoneアプリの詳細情報
Use the Stock Trade Entry Point application to find trading opportunities as well as optimal entering and exiting prices and other setup for trades to maximize profits and minimize risks.
The analysis starts with finding support and resistance levels based on pivot points, gaps and major moving averages commonly used by traders. The strength of each support and resistance level is further determined by various characteristics of the levels including number of occurrences, volume strength and number of times they have succeeded or failed with providing support or resistance in the past, etc.
When US market is open, the analysis takes the real time price of the stock (or ETF) in comparison with its support and resistance levels to find suitable trading opportunities. Range bound strategy looks for a large price swing between strong support and resistance levels. Break out strategy looks for opportunities for a price movement to penetrate a resistance level and for the previous resistance level to become support. Break down strategy works similarly to the break out strategy but for the price going in the other direction. There are also cases when the price is going for a ride without any resistance or taking a dive without any support.
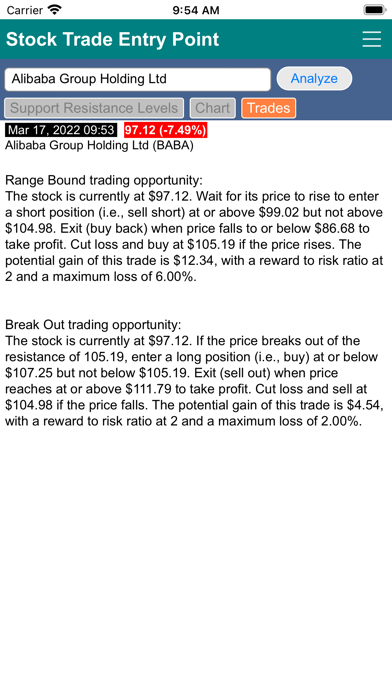
Once a suitable trading opportunity is found, the analyzer calculates the entering price with the setup criteria, exit price and cut loss price as well as the gain, maximum losses percentage, and reward-to-risk ratio.
In the Summary screen, support resistance levels are shown with their price ranges, types, intensity and strength. You can also click the “+” (show details) button to bring up the detail view of the level. For the example of a pivot point level, the detail view shows the occurrence of each pivot point instance with its date, price, volume, average volume and volume strength.
The Chart screen show the candle stick charting of the stock within the analysis date range. The last ticker (current price) is shown with the support resistance levels, gaps and EMAs, which gives a visual representation of where all the prices sit at as well as the strength of the supports and resistances.
The analysis starts with finding support and resistance levels based on pivot points, gaps and major moving averages commonly used by traders. The strength of each support and resistance level is further determined by various characteristics of the levels including number of occurrences, volume strength and number of times they have succeeded or failed with providing support or resistance in the past, etc.
When US market is open, the analysis takes the real time price of the stock (or ETF) in comparison with its support and resistance levels to find suitable trading opportunities. Range bound strategy looks for a large price swing between strong support and resistance levels. Break out strategy looks for opportunities for a price movement to penetrate a resistance level and for the previous resistance level to become support. Break down strategy works similarly to the break out strategy but for the price going in the other direction. There are also cases when the price is going for a ride without any resistance or taking a dive without any support.
Once a suitable trading opportunity is found, the analyzer calculates the entering price with the setup criteria, exit price and cut loss price as well as the gain, maximum losses percentage, and reward-to-risk ratio.
In the Summary screen, support resistance levels are shown with their price ranges, types, intensity and strength. You can also click the “+” (show details) button to bring up the detail view of the level. For the example of a pivot point level, the detail view shows the occurrence of each pivot point instance with its date, price, volume, average volume and volume strength.
The Chart screen show the candle stick charting of the stock within the analysis date range. The last ticker (current price) is shown with the support resistance levels, gaps and EMAs, which gives a visual representation of where all the prices sit at as well as the strength of the supports and resistances.
 このアプリはiPhone、iPadの両方に対応しています。
カテゴリー
ファイナンス
ファイナンス
リリース
2022/3/8
2022/3/8
更新
2022/3/18
2022/3/18
バージョン
1.1.1
1.1.1
言語
サイズ
2.8 MB
2.8 MB
条件
このバージョンの新機能
.Color shades for representing strengths of support resistance levels for easy understanding of where current price stand in one glimpse.
.Include more data (current price and change percentage from previous close) on various screens for easy usages.
.Color shades for representing strengths of support resistance levels for easy understanding of where current price stand in one glimpse.
.Include more data (current price and change percentage from previous close) on various screens for easy usages.
スクリーンショット - iPhone | iPad
スクリーンショット - iPhone | iPad
George Kung の他のアプリ » もっと見る
» 目的別iPhoneアプリ検索
- 辞書 » 日本語対応の辞書 » 英和辞典
- 学習 » 英単語 » 英会話 » クイズで楽しく
- スケジュール » 管理 » Googleカレンダー


au WALLET
KDDI CORPORATION無料
楽天カード
RAKUTEN CARD,INC.無料
セゾンPortal/クレジット管理
Credit Saison Co., Ltd.無料
家計簿おカネレコ - 人気おこづかい帳家計簿(かけいぼ)
Smart Idea inc.無料
家計簿でおこづかいが貯まる!ポイントGET家計簿アプリ!家計..
Aiko Tanaka無料
家計簿Zaimレシート読取・自動連携が無料の人気簡単アプリ
Zaim Inc.無料
かんたん家計簿 ポチレコ(POCHIRECO)
Yahoo Japan Corp.無料
楽天銀行
楽天銀行株式会社無料
Yahoo!ファイナンス - 株価・為替の総合アプリ(無料)
Yahoo Japan Corp.無料
エポスカード公式アプリ
株式会社エポスカード無料


CatchApp新着アプリレビュー
 日本縦断てつどうの旅」")
様々な楽しみ方で運転士として成長していく鉄道運転士育成RPG「プラチナ・トレイン(プラトレ) 日本縦断てつどうの旅」
2016-05-17 00:00

日本語にはない英語発音のリスニングを楽しく学べる「発音どっち?英語リスニング 」
2014-12-20 12:00

指先の瞬発力が試されるカジュアルゲーム「早撃ちパニック」をリリース!
2014-12-08 15:21
新着アプリ動画
-
 ¥1500
¥1500
-
 ¥600
¥600
-
 ¥3000
¥3000